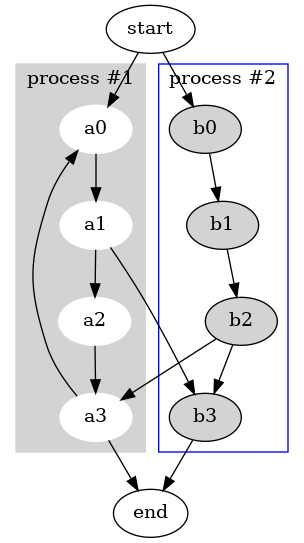
Basic example
$graph = new Graphviz\Digraph();
$graph
    ->subgraph('cluster_0')
        ->set('style', 'filled')
        ->set('color', 'lightgrey')
        ->attr('node', ['style' => 'filled', 'color' => 'white'])
        ->edge(['a0', 'a1', 'a2', 'a3'])
        ->set('label', 'process #1')
    ->end()
    ->subgraph('cluster_1')
        ->attr('node', ['style' => 'filled'])
        ->edge(['b0', 'b1', 'b2', 'b3'])
        ->set('label', 'process #2')
        ->set('color', 'blue')
    ->end()
    ->edge(['start', 'a0'])
    ->edge(['start', 'b0'])
    ->edge(['a1', 'b3'])
    ->edge(['b2', 'a3'])
    ->edge(['a3', 'a0'])
    ->edge(['a3', 'end'])
    ->edge(['b3', 'end'])
;